Triangles vs. Bull Pennants: How Traders Use Them
- Editorial Staff

- Oct 22, 2024
- 3 min read
Essential tools in technical analysis, chart patterns enable traders to identify possible trends and guide entrance or exit positions. Two of the most often mistaken patterns are triangular formations and the bull pennant. Even if they seem comparable, knowing their little variances will greatly affect your trading approach. The special features of bull pennants and triangles are investigated in this paper together with how traders make good use of them in various market environments.

What Is a Bull Pennant?
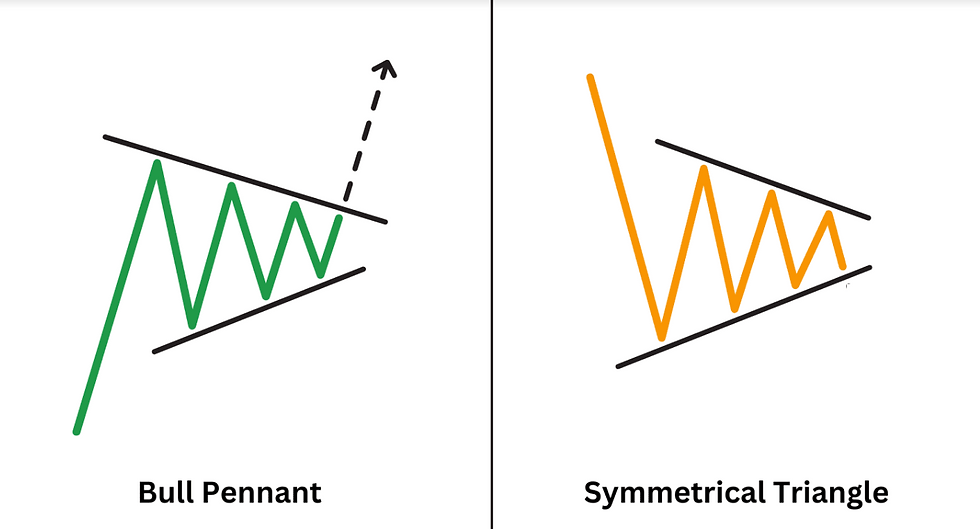
An upward trend produces a bull pennant, a continuation pattern. It shows up when a flagpole—a strong price increase—is followed by a short period of consolidation. As the price closes between two convergent trendlines, this consolidation creates a little symmetrical triangle. Once the market picks back up, the price usually follows the same direction as the past trend, giving investors an opportunity to gain from the rising movement.
Bull pennants help traders verify that a trend is probably going to last. Usually occurring with increasing volume, a breakout validates the pattern and indicates an entrance point. Usually developing over a brief period, bull pennants are perfect for swing traders and other short-term traders.
What Is a Triangle Pattern?
Though it can show in both positive and negative trends, a triangle pattern is also a consolidation pattern. Usually forming longer than bull pennants, triangles have a more general range. Triangle patterns generally come in three varieties:
Symmetrical Triangle: Both trendlines converge, signaling market indecision.
Ascending Triangle: The upper trendline is flat, while the lower trendline slopes upward, suggesting a potential breakout to the upside.
Descending Triangle: The lower trendline is flat, with the upper trendline sloping downward, indicating a possible bearish breakout.
Triangles help traders since they imply that market volatility is compressing, which is usually followed by a strong breakout. But with symmetric triangles, the path of the breakout is not always obvious, hence traders must wait for confirmation.
Comparing Bull Pennants and Triangles
Although both designs have trendlines and consolidation phases, certain important distinctions separate them. Whereas triangles indicate that the market is getting ready for a breakout in either direction, bull pennants concentrate on trend continuity during an uptrend.
Table: Key Differences Between Bull Pennants and Triangles
Feature | Bull Pennant | Triangle Pattern |
Duration | Short (few days to 2 weeks) | Longer (weeks to months) |
Type | Continuation pattern | Continuation or Reversal |
Breakout Direction | Same as previous trend | Can be upward or downward |
Common Market | Stocks, Forex, Cryptocurrencies | All financial markets |
Volume Indicator | Spike on breakout | Gradual increase or decrease |
Bull pennants are ideal for traders looking to ride existing trends, while triangles help traders plan for breakouts in both directions.
How Traders Use Bull Pennants and Triangles
Traders implement different strategies when they spot bull pennants or triangle patterns on their charts.
Trading Bull Pennants
Traders wait for the breakthrough over the top trendline to validate a bull pennant that emerges. Usually positioned below the lower trendline, a stop-loss helps to control any losses should the breakout fail.
Usually, one finds the profit goal for a bull pennant by adding the flagpole's length to the breakout point. This offers traders a projected pricing range to pull out from their investments.
Trading Triangle Patterns
Triangles need a different strategy since the breakout direction is less known. Two orders are common placed by traders: one above the top trendline and one below the lower trendline. One order is set off when the breakout happens while another is canceled.
In triangle breakouts, volume also is quite important. Strong volume increases in patterns during the breakout usually produce more consistent price fluctuations. Alchemy Markets and related sites' traders actively watch volume to support their transactions, therefore guaranteeing their actions on confirmed breakouts.
Real-Life Examples of Bull Pennants and Triangles
Bull pennants and triangles find their place in several financial markets, including equities, currencies, and cryptocurrencies. Following a favorable earnings release, a bull pennant could develop in the stock market indicating that investors are eager to drive the price higher.
Triangles abound in the bitcoin market during times of great volatility. These patterns help traders predict significant price swings—common in assets like Bitcoin or Ethereum—by means of their frequency.
Conclusion
Knowing the variations between triangles and bull pennants will help traders have a major advantage on the market. While triangle patterns let traders be ready for breakouts in any direction, bull pennants provide obvious chances to leverage trend continuance.
Mastery of these patterns helps traders make better decisions, therefore increasing their chances of success. Whether you trade stocks, FX, or cryptocurrency, including both bull pennants and triangles into your trading plan will enable you to adjust to different market conditions.
Related Content


